GigaSMART Inline TLS/SSL Dashboards
GigaSMART Inline TLS/SSL Dashboards offer insights into session performance, network capacity, traffic decryption, compliance analysis, and historical data. Monitoring decryption statuses and anomalies helps organizations enhance security.
These dashboards provide real-time alerts and detailed reports for network security administrators to maintain data integrity and security compliance. It allows you to visualize the information with GigaVUE-FM. These dashboards are supported only for Gen 3 GigaSMART card platforms.
A few of the use case scenarios where the Inline TLS/SSL Dashboard could detect and manage anomalies:
| Alert administrators when a TLS handshake involves certificates signed with insecure hash algorithms. |
| Alerts can be triggered when CBC mode is used, especially in older versions of TLS (for example, TLS 1.0 and TLS 1.1), advising an upgrade to more secure cipher modes like GCM (Galois/Counter Mode). |
| Identify and report the use of certificates with weak signatures in the network traffic, facilitating a swift response to enhance security. |
| Automatic detection and reporting of expired certificates help maintain continuous security compliance and trust. |
| Monitoring and analyzing trends in decryption success and failure rates can pinpoint disruptions or anomalies in encrypted traffic handling. |
| Ensure only approved cryptographic standards are used and generate compliance reports for auditing purposes. |
To access the dashboard:
- Go to
 -> Analytics -> Dashboards.
 - Click on the required dashboard to view the visualizations.
Inline TLS/SSL Dashboard can be categorized into two types:
| Basic Dashboards |
| Advanced Dashboards |
Basic Dashboards
The Basic dashboards are available by default and provides an overall information on the session. You can use the below control filters and specify the time period to visualize and filter the dashboard information:
| Host Name |
| GigaSMART Groups Alias ( GSGroup Alias) |
| GigaSMART Engine ID ( GSEngine ID) |
The following are the basic dashboards and its visualizations:
|
Dashboard |
Description |
Visualizations |
Details |
|---|---|---|---|
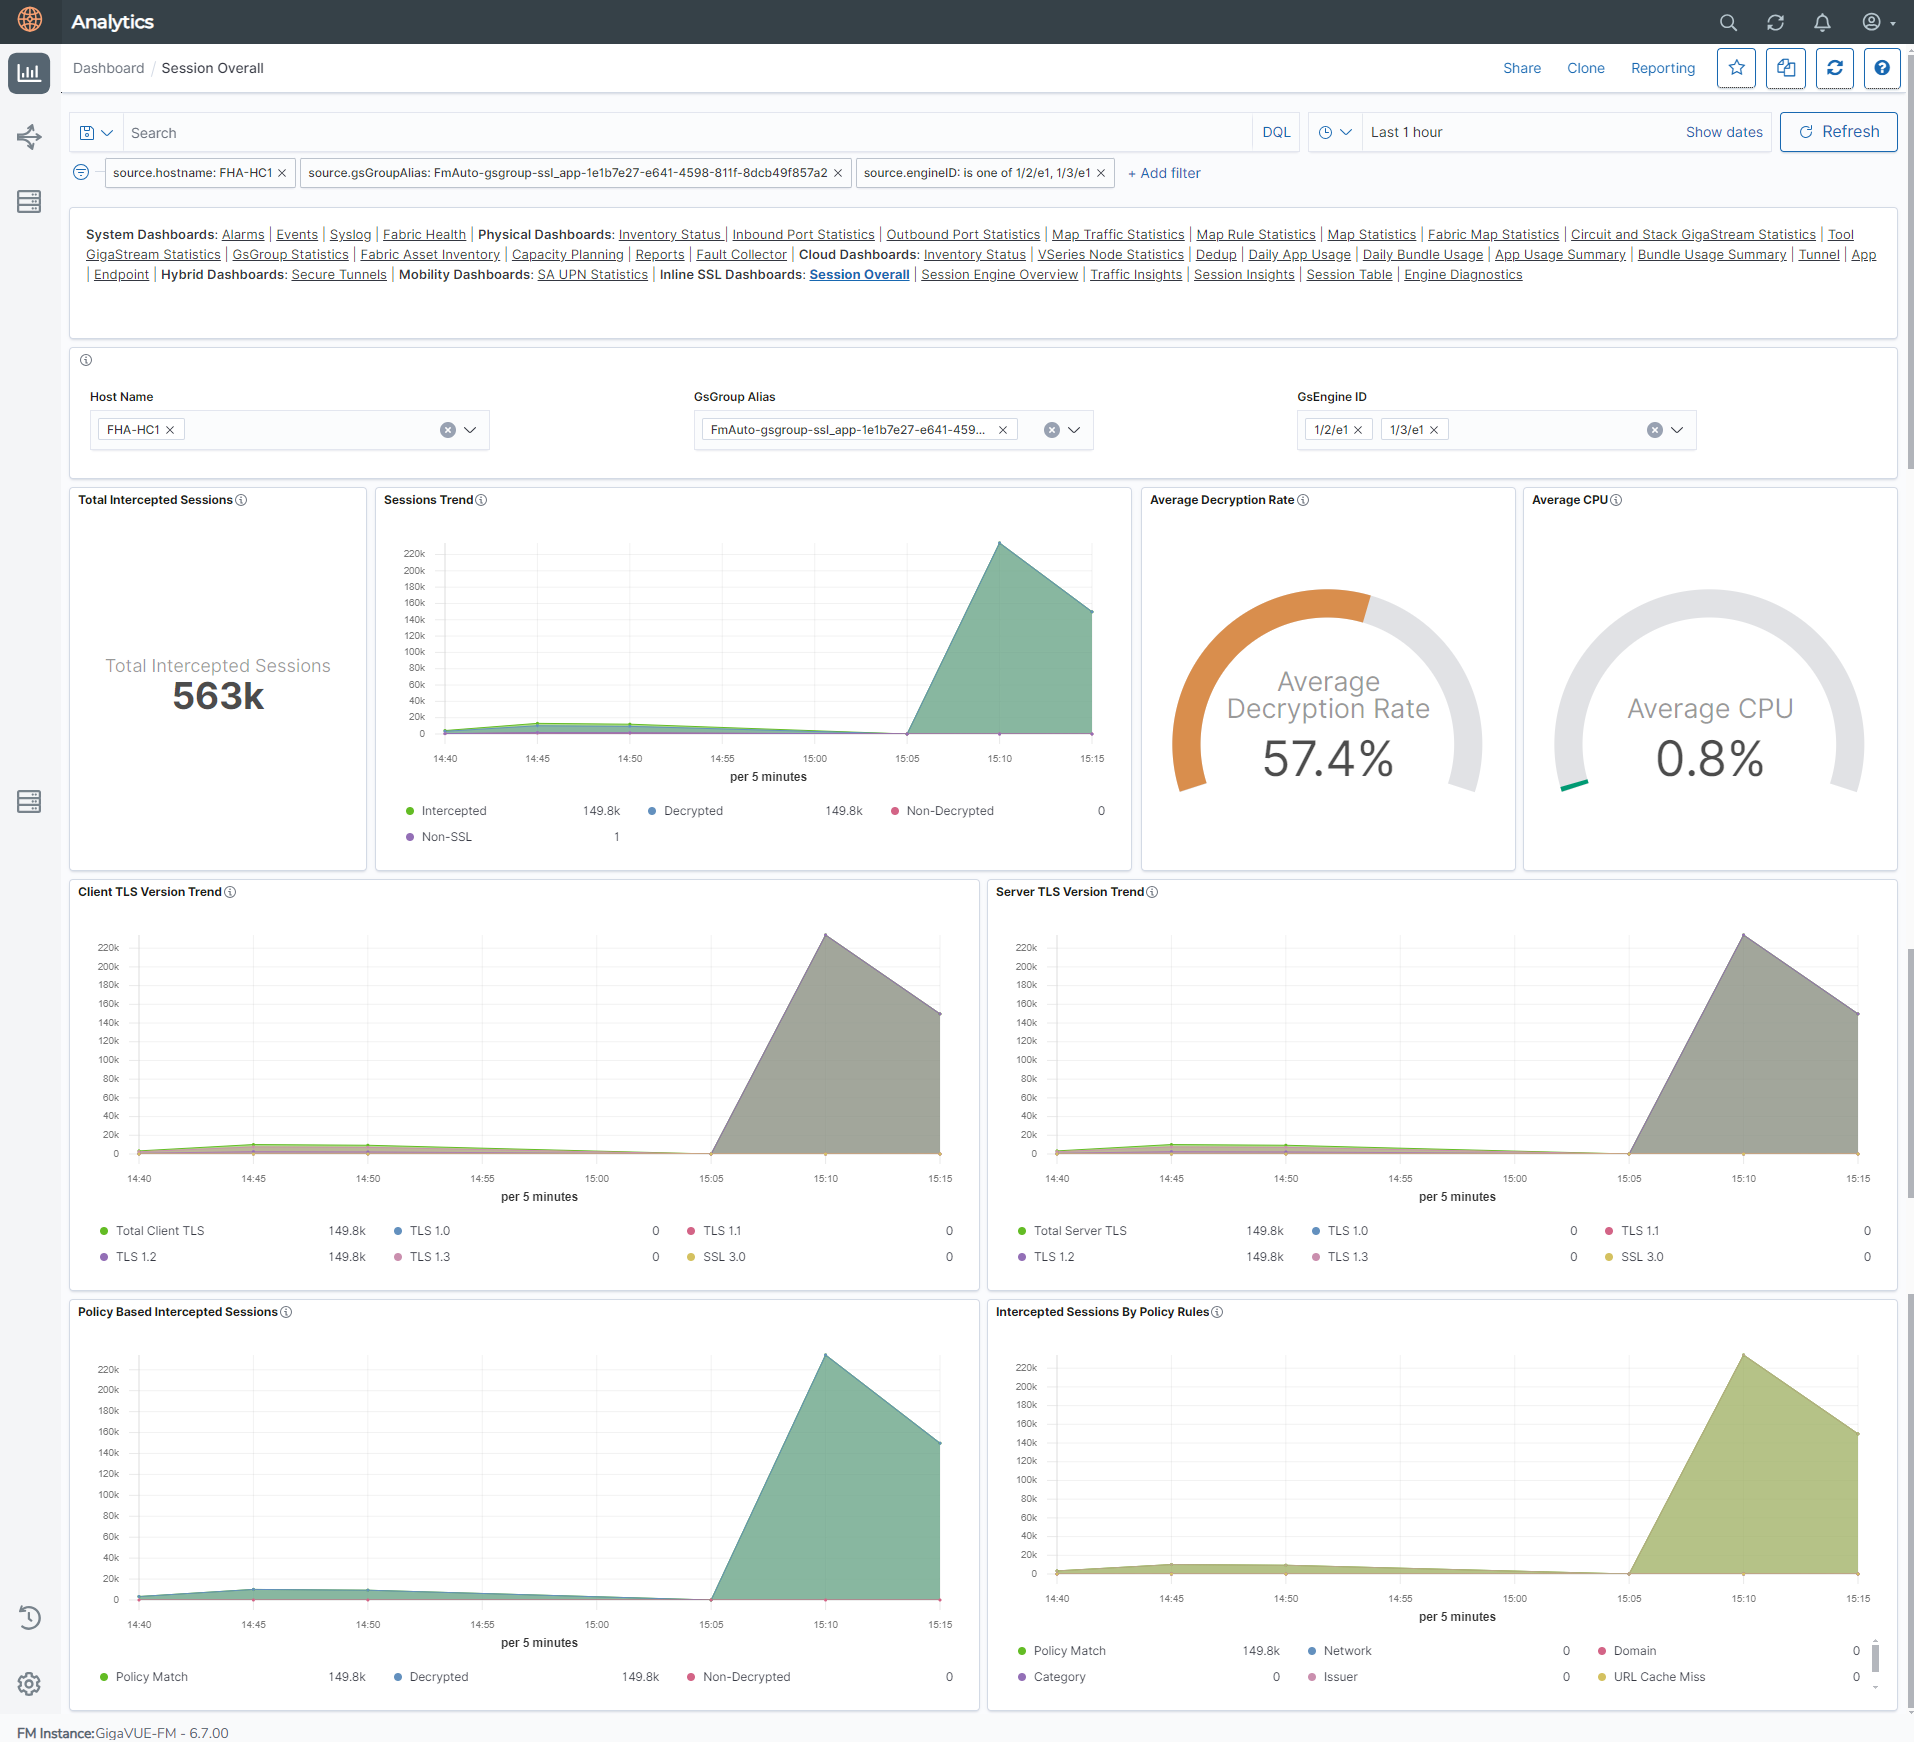
| Session Overall
|
Displays visualizations on the overall details of encrypted traffic.
|
Total Intercepted Sessions |
Displays overall count of intercepted sessions by the node over time period. This page does not display per engine unless specified by a filter.
|
| Sessions Trend |
Displays the trend of all Inline TLS/SSL session that has been received over a specified time period and per specified GigaSMART engines. The trend included the visualization of the Intercepted/Decrypted/Non-SSL Sessions. |
||
| Average Decryption Rate | Displays the average rate of Inline TLS/SSL sessions that have been decrypted over the specified time period.. | ||
| Average CPU | Displays an average CPU utilization of all engines in Session Overall Page. | ||
| Client TLS Version Trend |
Displays an overview of the incoming traffic's TLS version of the incoming data.
|
||
|
Server TLS Version Trend |
Provides an insight into the TLS version distribution at the server side. |
||
|
Policy based Intercepted Session |
Displays the trend of decryption status of Inline TLS/SSL session based policy.
|
||
|
Intercepted Sessions By Policy Rules |
Displays the trend of Inline TLS/SSL session based on Policy rules such as; Domain ,Category, Issuer, URL Cache Miss, Network and Default. Note: The no. of sessions that gets matched to a Network Policy Rule will not be displayed in the Total Intercepted Session widget. |
|
Dashboard |
Description |
Visualizations |
Details |
|---|---|---|---|
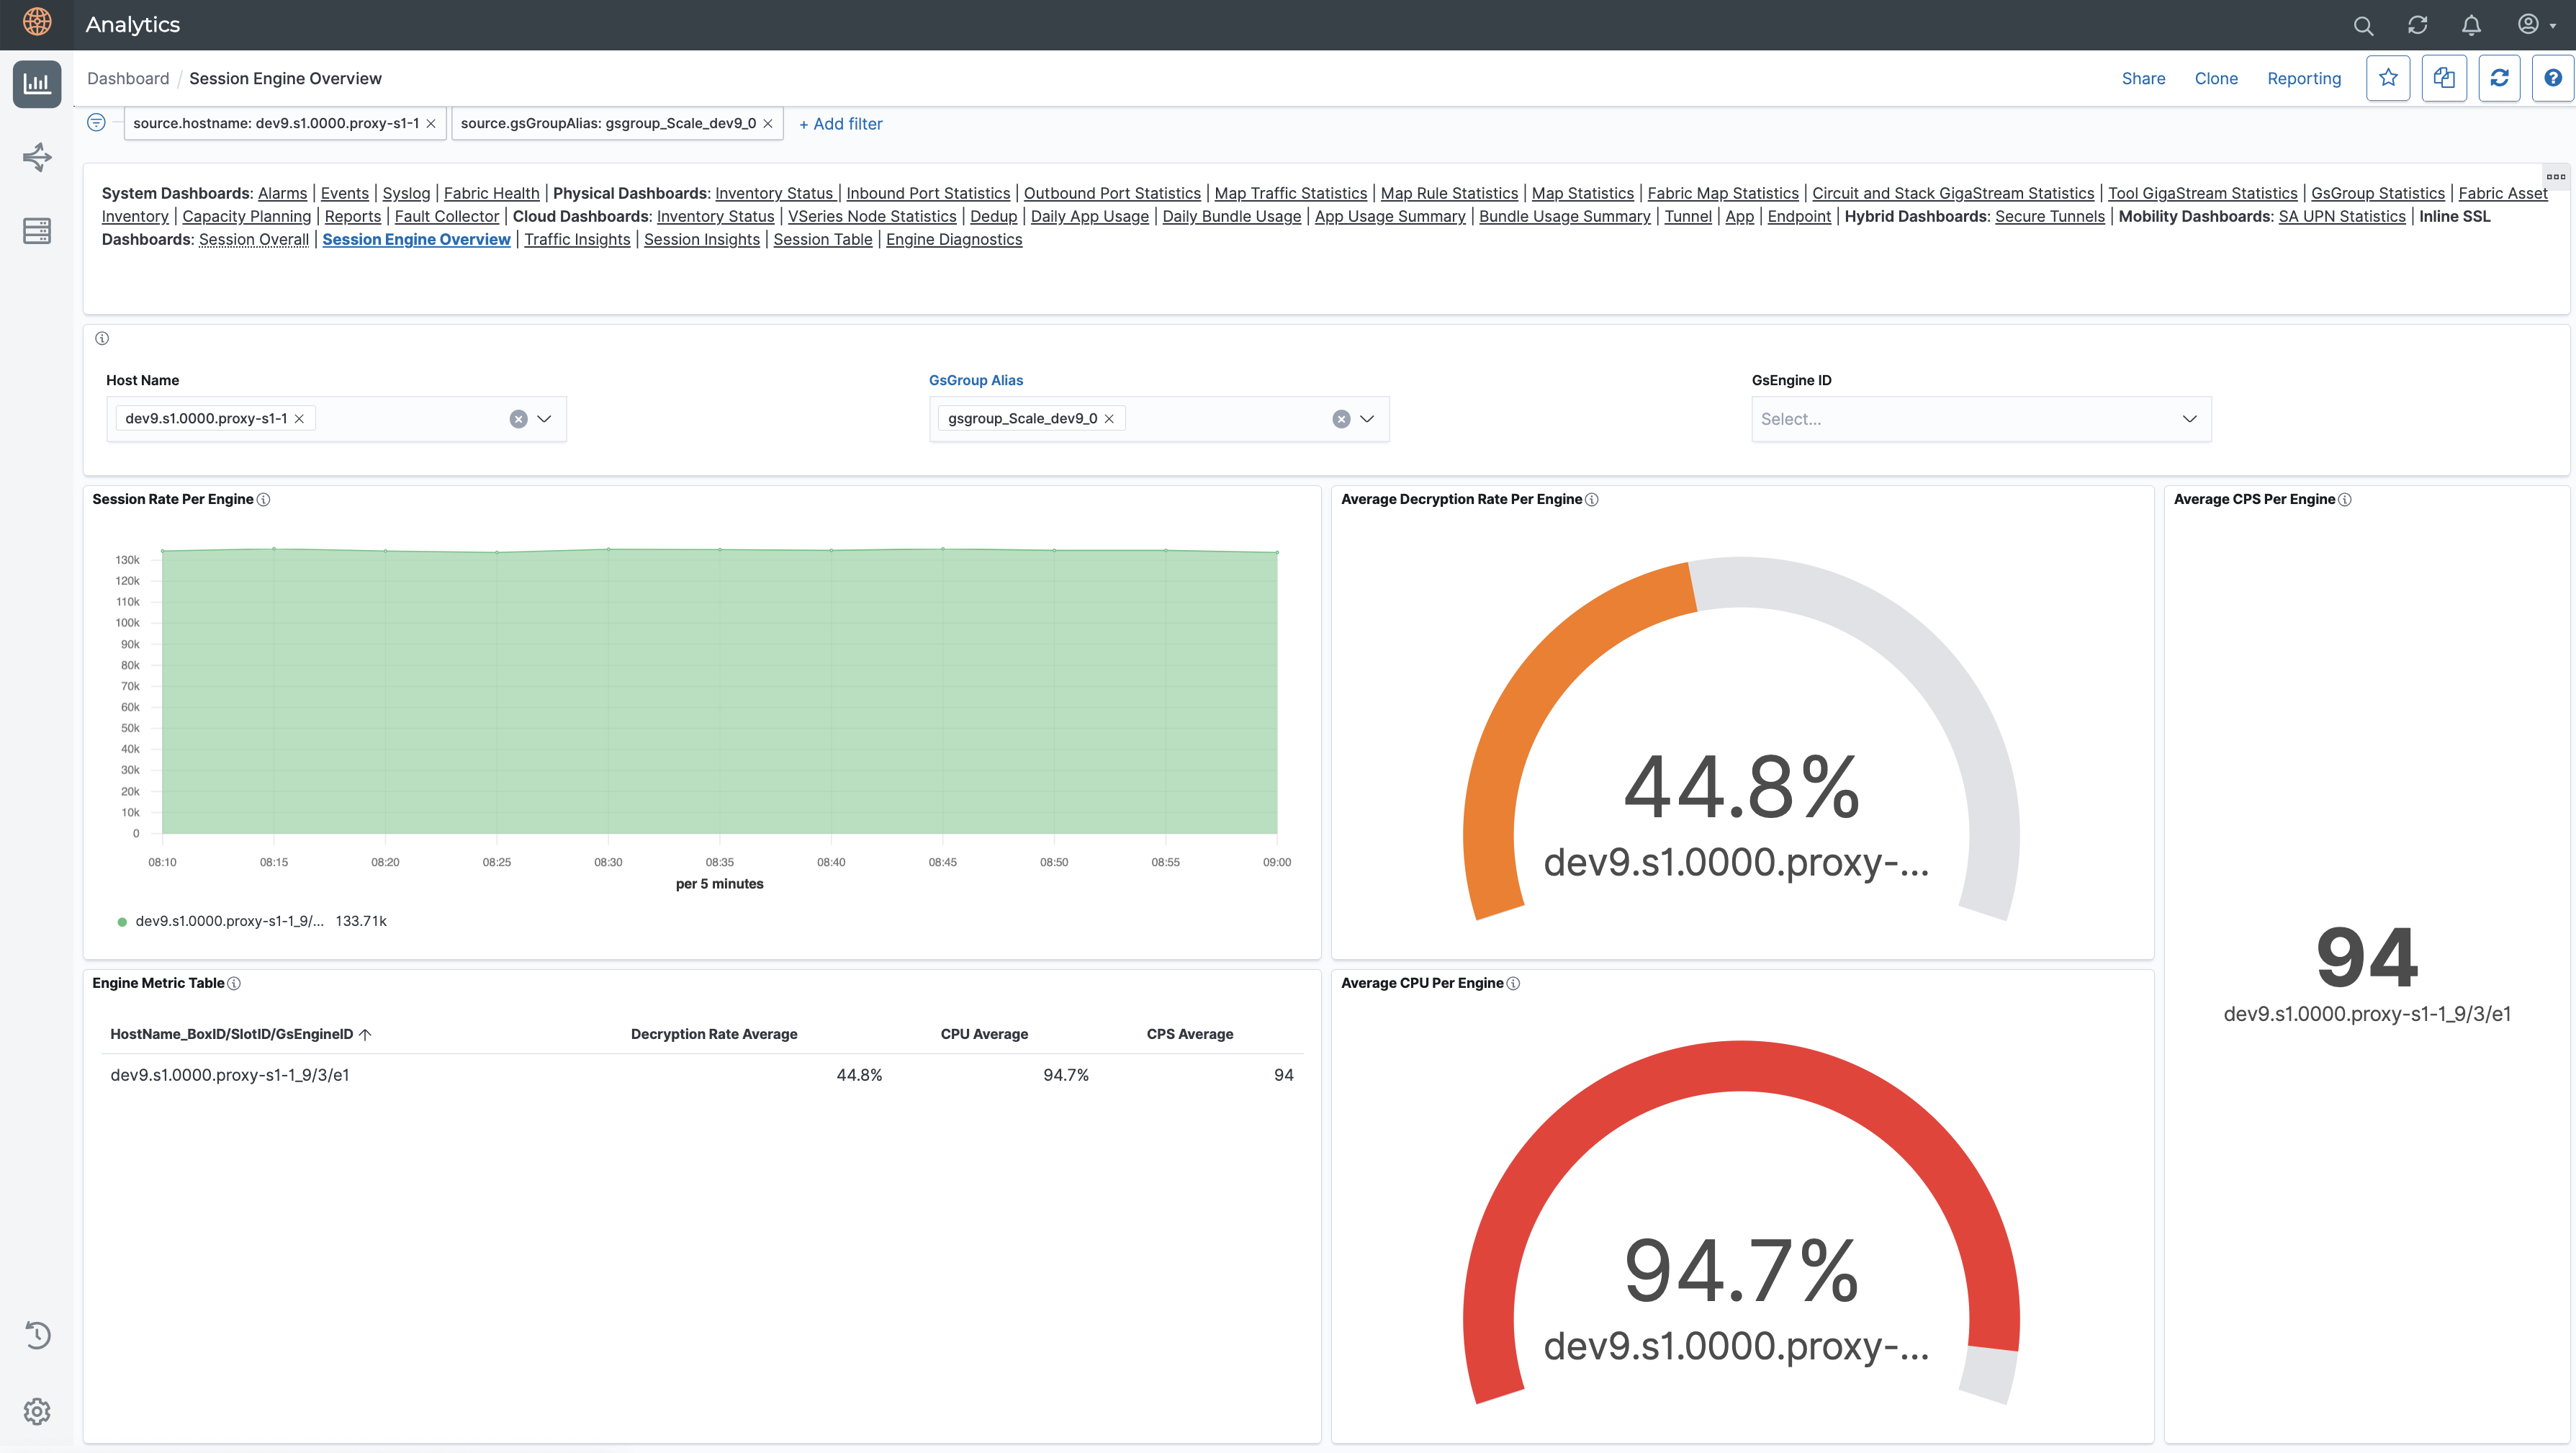
| Session Engine Overview
|
Displays visualizations related to Inline TLS/SSL Sessions per Engine
|
Sessions Rate per Engine | Displays the rate at which Inline TLS/SSL sessions are intercepted per engine. |
| Average Decryption Rate per Engine | Displays the average rate of sessions that got decrypted per engine. | ||
|
Average CPS per Engine |
Displays the average Connections per Second (CPS) performance metric per engine. |
||
|
Average CPU per Engine |
Displays the average CPU utilization per engine. |
||
|
Engine Metric Table |
Displays the Decryption rate per engine, average CPS and average CPU rate in a tabular format. The details are displayed as Host Name/Engine ID. For example; FHA-HC1 (Host Name)_1/3/e11( GSEngine ID) |
|
Dashboard |
Description |
Visualizations |
Details |
|---|---|---|---|
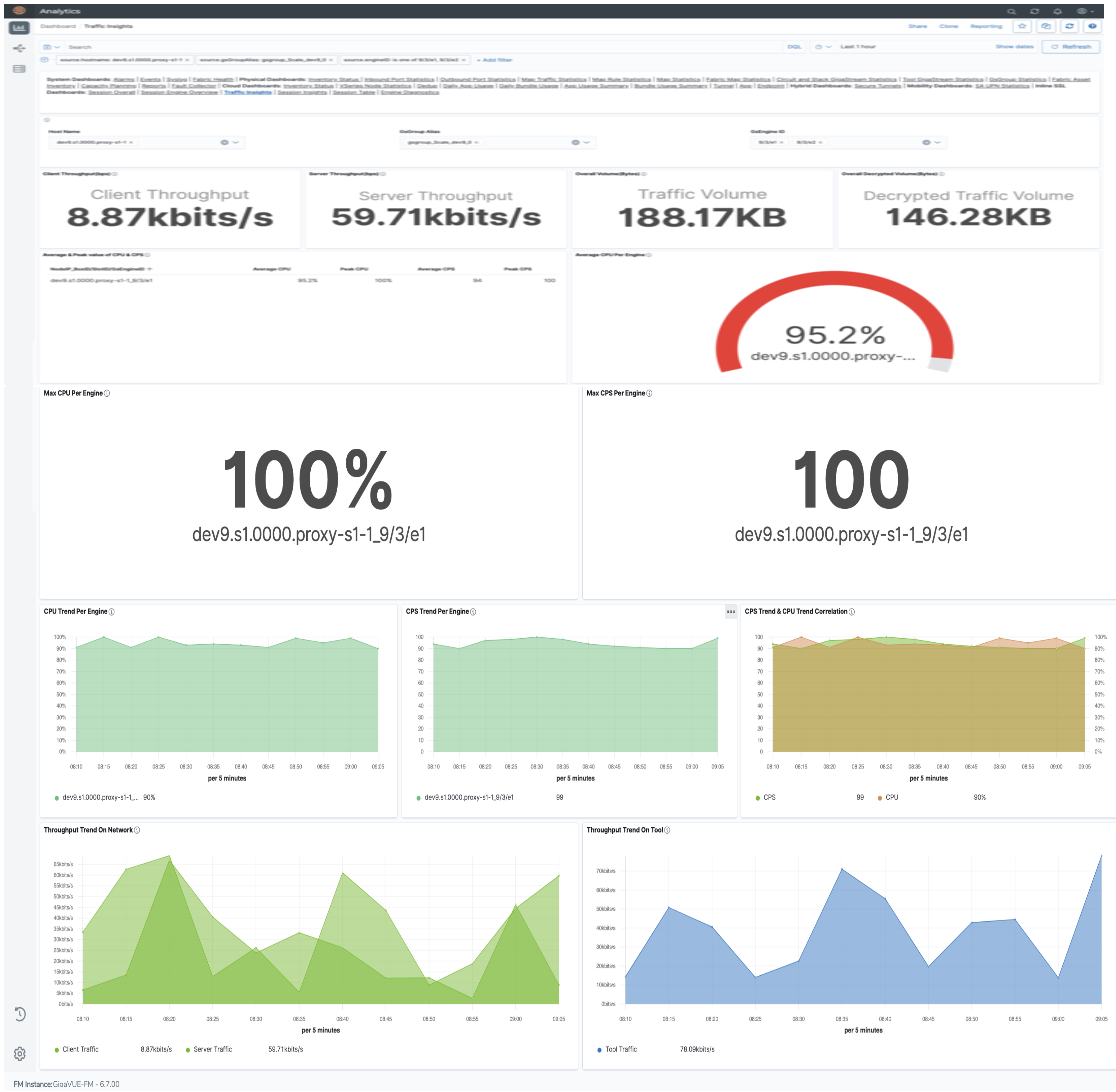
| Traffic Insights | Displays visualizations related to the traffic that is handled with a Inline TLS/SSL sessions
|
Client and Server Throughput (bps) |
Displays the traffic throughput that is received from the client and the throughput that is handled at the server side. This throughput is displayed in bits per second (bps)value.
|
| Overall Volume(Bytes) |
Displays the volume of traffic that is being handled in Bytes. This takes into account both TCP and SSL sessions.
|
||
|
Overall Decrypted Volume (Bytes)
|
Displays the overall decrypted volume of all engines unless filtered by engine ID control filter in Bytes unit |
||
|
Average CPU Per Engine |
Displays the average CPU performance per engine |
||
|
Max CPU Per Engine |
Displays the maximum CPU utilization that was observed per engine. This is static rate and is not displayed based on a time frame. |
||
|
Max CPS Per Engine |
Displays the maximum Connection Per Second (CPS) rate that was observed per engine. This is static rate and is not displayed based on a time frame. |
||
| Average & Peak value of CPU & CPS | Displays the average and peak values of CPU and CPS observed per engine in a tabular format. | ||
| CPU Trend per Engine |
Displays a trend of CPU utilization that was achieved over a time period per engine. |
||
|
CPS Trend per Engine |
Displays a trend of the Connections per Second that was achieved over a time period per engine. |
||
|
CPS Trend & CPU Trend Correlation |
Displays a correlation between the CPU and CPS trend of the engine within a time period. |
||
|
Throughput Trend on Network |
Display the throughput trend of traffic that was received from both client and server side. |
||
|
Throughput Trend on Tool |
Displays the throughput trend of traffic that was received on the Tool. |
|
Dashboard |
Description |
Visualizations |
Details |
|---|---|---|---|
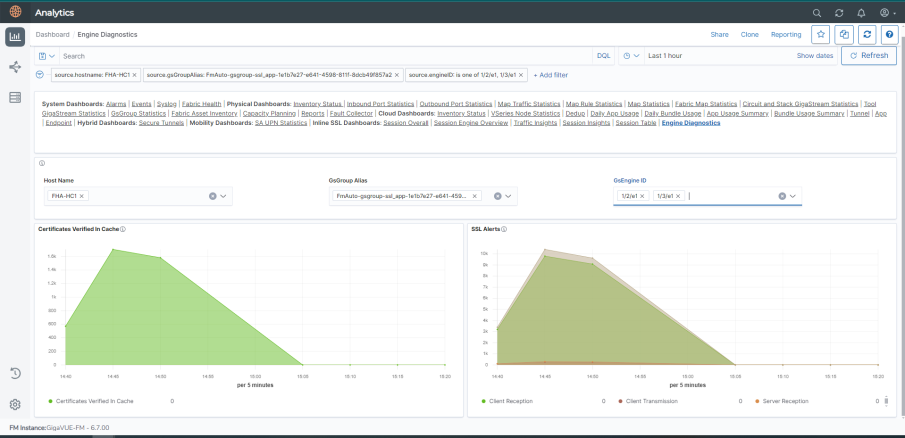
| Engine Diagnostics | Displays the certificates and SSL alerts related to a GigaSMART engine | Certificates verified in Cache |
Displays the number of certificates that were verified in cache over a time period
|
| SSL Alerts | Displays the number of SSL alerts that were received both from client and server. |
Advanced Dashboards
Advanced Dashboards are available only if you enable it while configuring your Inline TLS/SSL Decryption session.
System Requirements
The system requirements for utilizing Inline TLS/SSL Advanced Dashboards are as shown below.
|
Requirements |
Support up to 100 Devices ( GigaVUE-FM Standalone) |
Support up to 100 Devices ( GigaVUE-FM HA Mode) |
|---|---|---|
|
Memory |
128GB |
128GB |
|
Virtual CPU |
Minimum 12 CPU Note: It is recommended to have 16 CPU for continuous traffic with maximum supported limit of 18k sessions/second for three Advanced Statistics enabled GigaSMART engines. |
Minimum 12 CPU Note: It is recommended to have 16 CPU for continuous traffic with maximum supported limit of 36k sessions/second for six Advanced Statistics enabled GigaSMART engines. |
|
Disk Space |
Refer to "Large Configuration" category under "Virtual Computing Resource Requirement in Scaled Environments" section in GigaVUE-FM Installation and Upgrade Guide for disk space details. |
Refer to "Large Configuration" category under "Virtual Computing Resource Requirement in Scaled Environments" section in GigaVUE-FM Installation and Upgrade Guide for disk space details. |
|
Virtual Network Interface |
1 |
1 |
|
Number of GigaVUE-FM nodes |
1 |
3 |
Configure Advanced dashboard
To configure advanced dashboards:
Go to, Traffic  >Configuration Canvas > Select the device> Inline SSL APP. >Configuration Canvas > Select the device> Inline SSL APP. |
| Enable the toggle option Advanced Session Statistics. |
Rules and Notes
Keep in mind the following rules and notes when using the Advanced Dashboard:
-
Advanced Dashboard data will be retained for 24 hours.
-
For a standalone GigaVUE‑FM node, the Advanced Dashboard is available for a maximum of three GigaSMART engines.
-
In a GigaVUE-FM High Availability group with three GigaVUE-FM nodes, a maximum of six GigaSMART engines will be supported.
-
Configure NTP time sync or ensure that your device and GigaVUE‑FM are synchronized with the date and time zone.
You can use the below control filters and specify the time period to visualize and filter the dashboard information:
| Host Name |
| GigaSMART Engine ID ( GSEngine ID) |
| URL (Only for Session Table Dashboard) |
| Source IP |
| Destination IP |
| URL Category (Only For Session Table Dashboard) |
The following are the advanced dashboards and its visualizations:
|
Dashboard |
Description |
Visualizations |
Details |
||||||||||
|---|---|---|---|---|---|---|---|---|---|---|---|---|---|
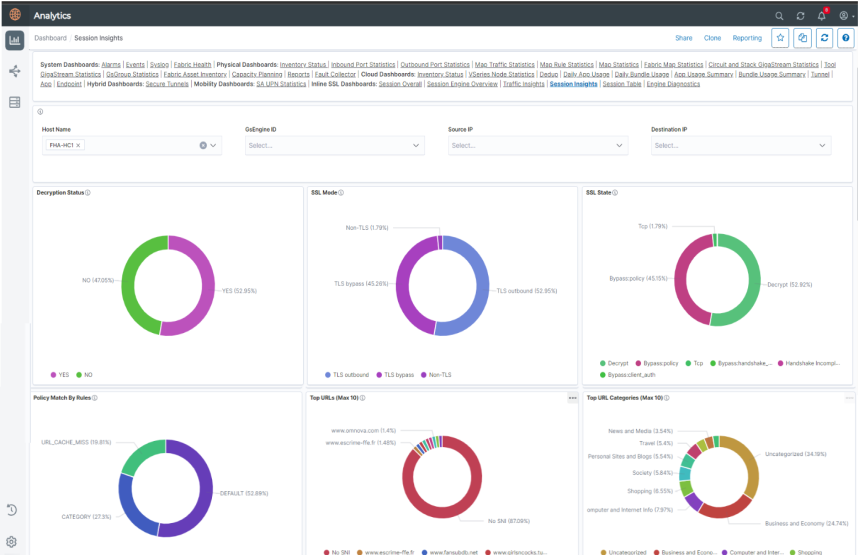
| Session Insights
|
Displays visualizations on the details of an Inline TLS/SSL session.
|
Decryption Status | Displays the number of Inline TLS/SSL sessions that were decrypted and not decrypted. | ||||||||||
| SSL Mode |
Displays the distribution of TLS/SSL Session modes. The modes are as follows:
|
||||||||||||
| SSL State |
Displays the distribution of TLS/SSL Session statuses.
|
||||||||||||
|
Policy Match By Rules |
Provides an insight into the TLS/SSL session that matches the Policy Rules. Note: The Policy Rule CATEGORY indicates the URL category. |
||||||||||||
|
TLS Version |
Displays the TLS version of the sessions. Note: The counter “Bypass/Error” denotes sessions that were not able to determine the TLS version. |
||||||||||||
|
Top URLS (Max 10) |
Displays the top 10 URLs that were accessed during the Inline TLS/SSL Session. |
||||||||||||
|
Top URL Category (10 Max) |
Displays the Category of top 10 URLs accessed in Inline TLS sessions Note: 'Uncategorized' signifies SNIs that could not be categorized or Non TLS sessions. Note: 'Unknown' signifies TLS Bypass and IP address based URLs. |
||||||||||||
|
Top Ciphers (Max 10) |
Displays the top 10 Ciphers that performed the Inline TLLS/SSL Decryption. |
||||||||||||
|
Certificates by Type |
Displays the certificates received are valid or non-valid. |
|
Dashboard |
Description |
Visualizations |
Dashboard |
|---|---|---|---|
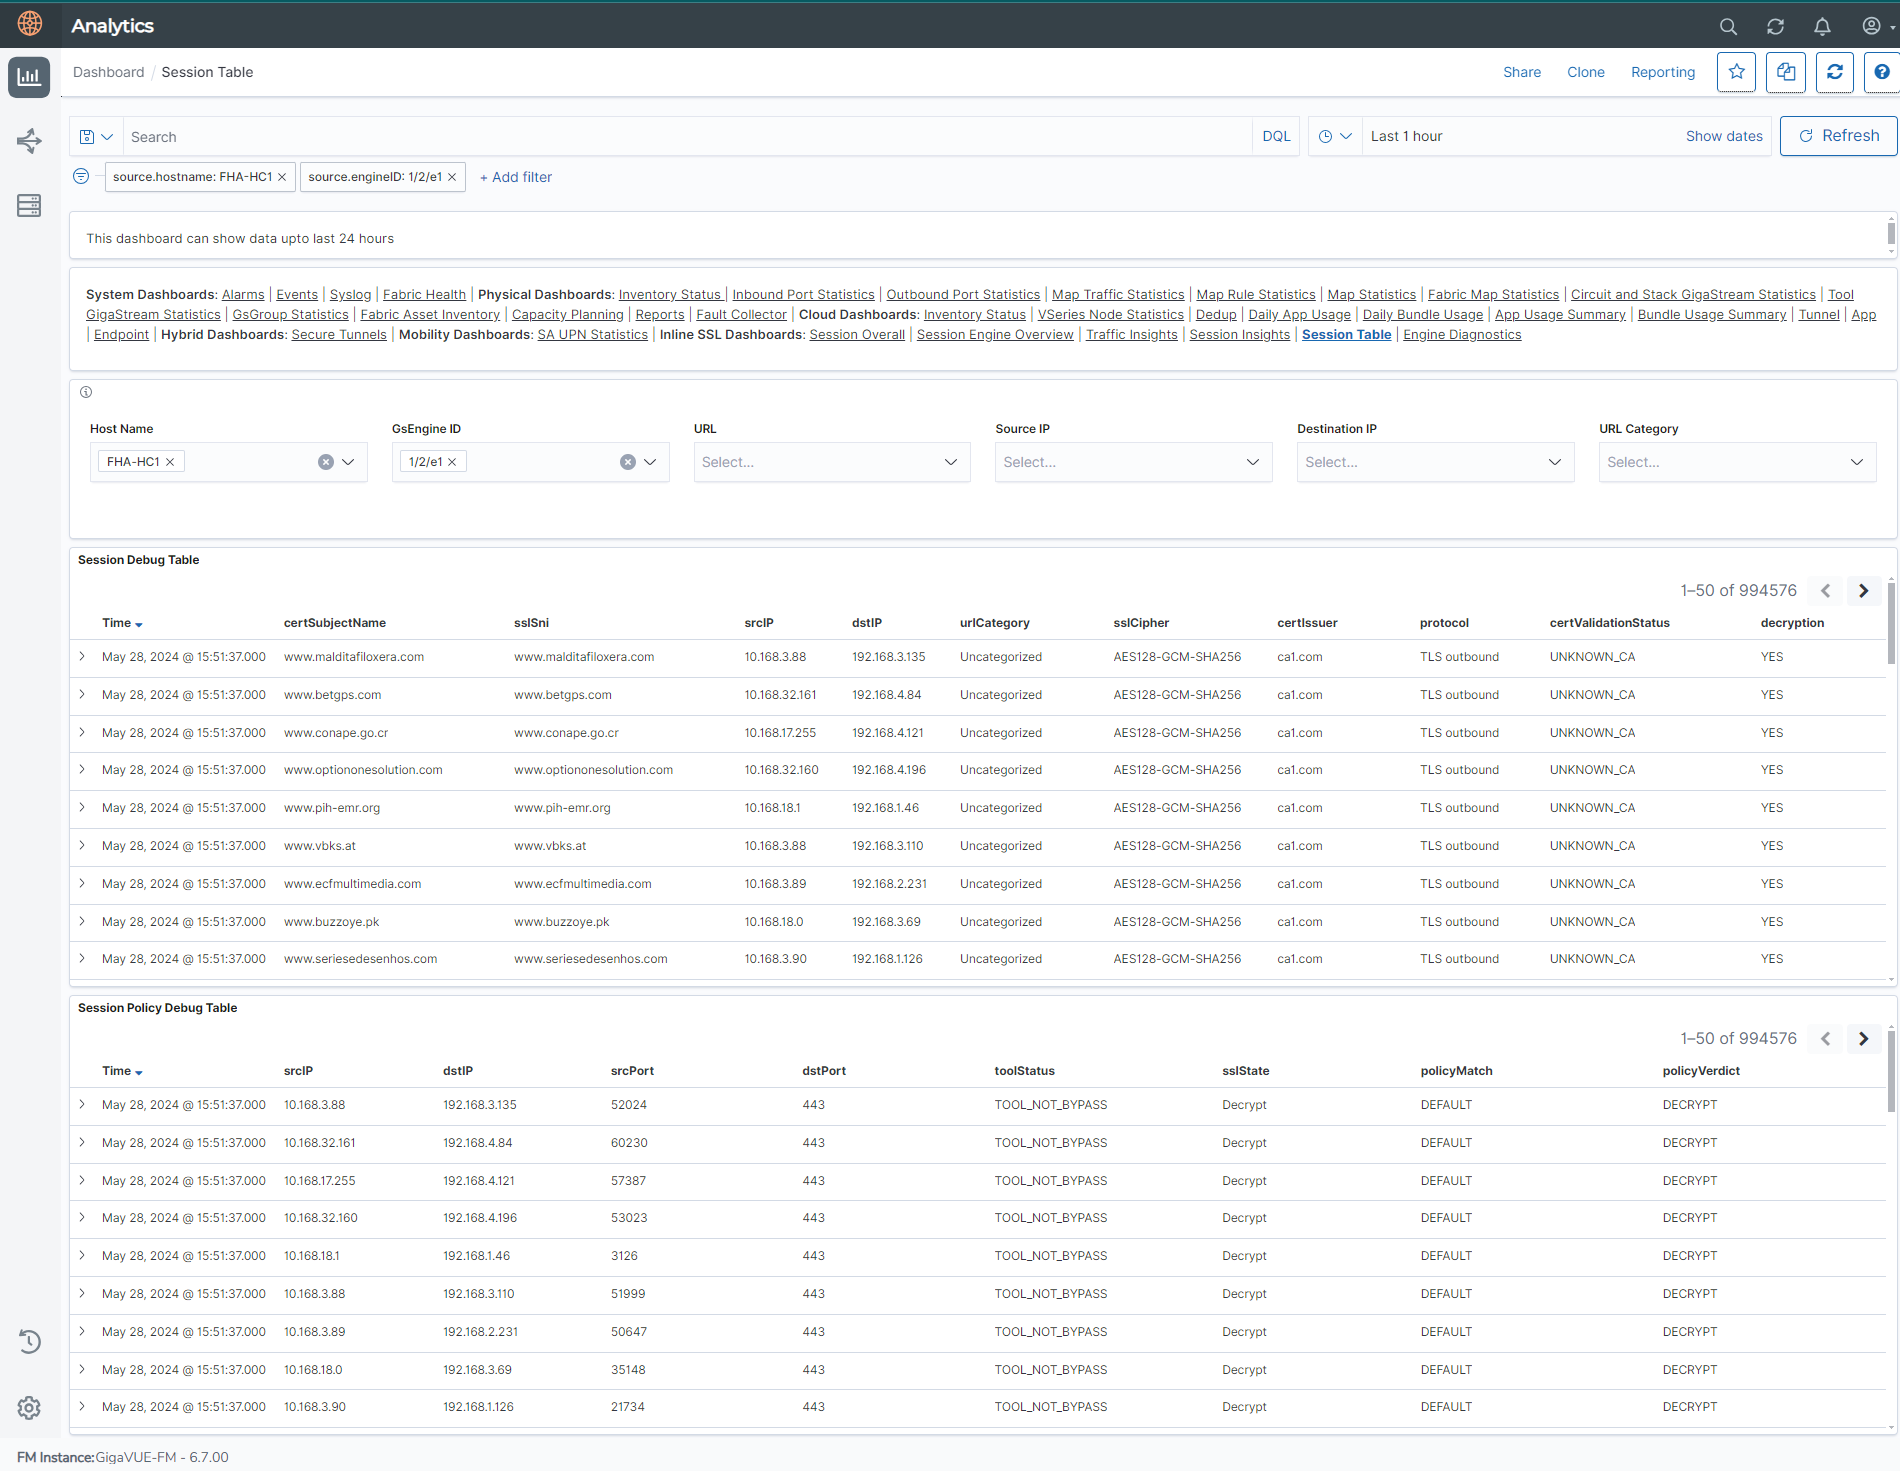
| Session Table | Displays visualizations related to Inline TLS/SSL Sessions per Engine in a tabular format.
|
Session Debug Table | Displays the entire Sessions Debug details throughout the system that has enabled Advanced Session Statistics. Each field can be added or removed as a customized filter option by using  button. button. |
| Session Policy Debug Table | Displays the entire Sessions Policy Debug details throughout the system that has enabled Advanced Session Statistics. It points out to the policy rules that got matched or the policy verdict of Decryption or non decryption. Each field can be added or removed as a customized filter option by using  button. button. |
